
Return Loss Guide for RF Connectors
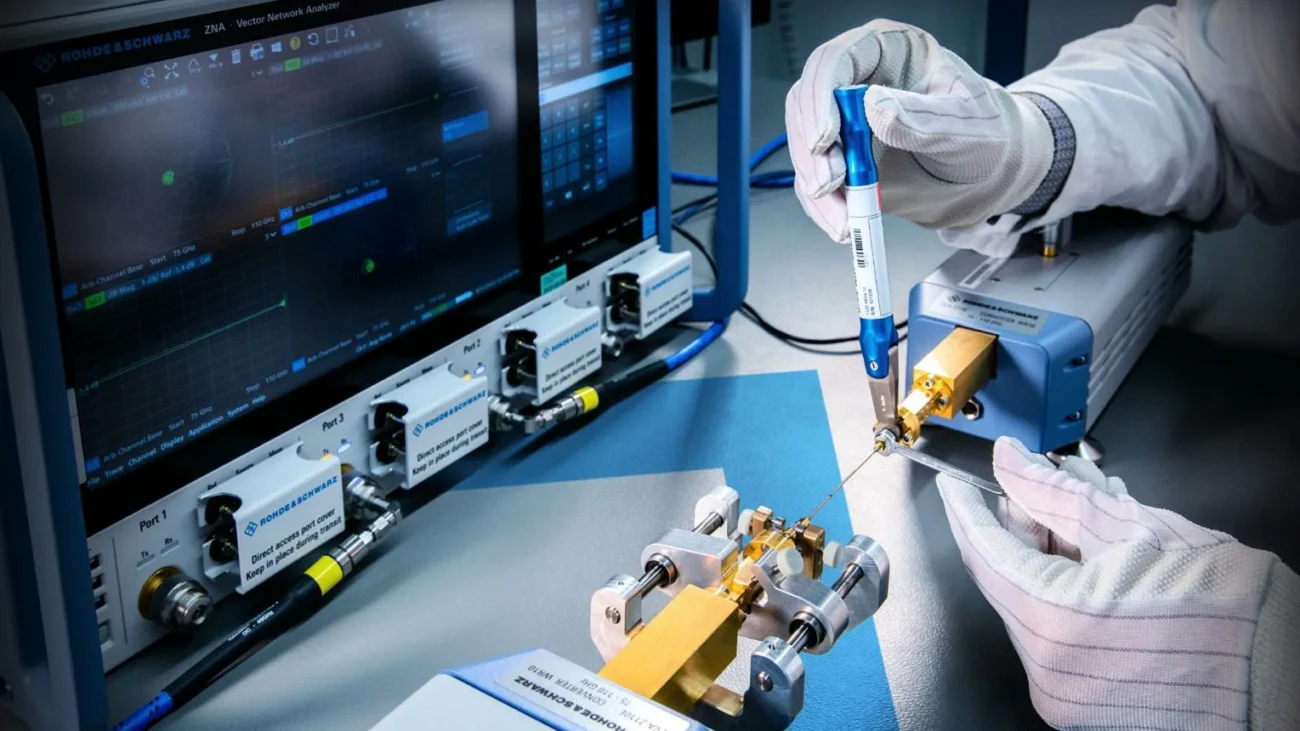
A customer once asked why a new SMA cable assembly could pass continuity testing but still fail during RF measurement.
From a normal electrical check, there was nothing wrong.
The connector was the correct model.
The cable length matched the drawing.
The signal could pass from one end to the other.
But when the assembly was connected to a vector network analyzer, the test curve showed unstable performance at the target frequency.
The issue was not an open circuit or short circuit.
It was reflection.
In RF systems, the signal does not only depend on whether the connection is physically connected. The electrical transition between each part also matters. A small change inside the connector structure can affect how the signal travels.
This is the reason engineers check return loss when evaluating RF connectors, coaxial cables, and cable assemblies.
How Should You Understand Return Loss During RF Testing?
Why does a connected RF path still create reflected signals?
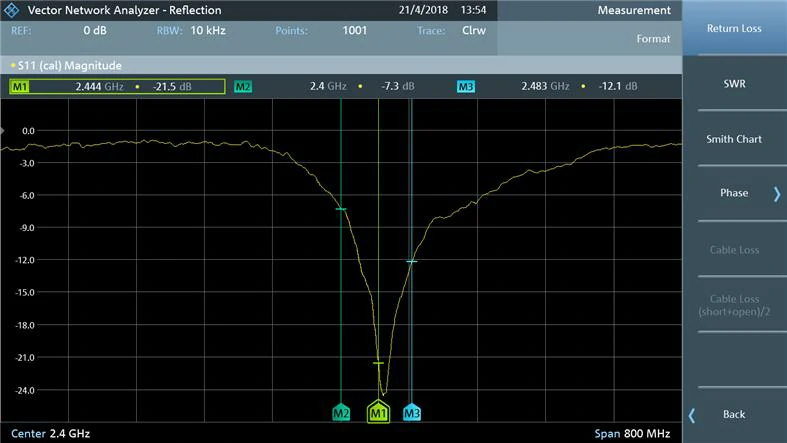
A vector network analyzer screen displays the S11 return loss response around 2.4 GHz. The markers show reflected signal levels at different frequencies and help engineers evaluate impedance matching, bandwidth, and RF system performance.
Many engineers coming from low-frequency applications are familiar with basic continuity testing.
Two points are connected.
The resistance looks normal.
The circuit works.
RF systems are different.
When the frequency increases, the cable and connector are no longer just conductors. Their physical dimensions become part of the electrical design.
The diameter of the center pin, the distance between conductor and shield, the dielectric material, and even the connector interface shape can influence impedance.
A typical RF system is designed around 50 ohms.
For a cable assembly:
- The connector needs to maintain 50 ohm impedance.
- The coaxial cable needs to maintain 50 ohm impedance.
- The connected equipment port also needs to match.
When these parts are close to the expected impedance, most of the RF energy continues forward.
When there is a mismatch, part of the signal returns toward the source.
That reflected energy is what return loss describes.
What does the return loss value actually tell you?
Return loss is normally shown in dB.
The number represents how much weaker the reflected signal is compared with the transmitted signal.
A higher return loss value means the reflected signal is smaller.
For instance:
A 10 dB return loss means the reflection is much higher than a 20 dB return loss.
A 20 dB return loss means the signal path has a better match.
A 30 dB result represents a very small reflection level.
In practical RF production, engineers usually do not judge return loss by one universal number. The acceptable value depends on:
- Working frequency
- Connector type
- Cable type
- Application requirement
- Test method
A cable assembly used for a simple communication device and a test cable used for laboratory measurement may have completely different requirements.
Why do SMA connectors often become the focus of return loss testing?
Among RF connectors, SMA is widely used because of its compact size and broad frequency capability.
It appears in:
- Antenna cables
- Wireless modules
- RF test equipment
- GPS systems
- Communication devices
However, small size also means the internal structure is sensitive.
A few examples:
The center contact position is slightly different.
The connector is not fully matched with the cable diameter.
The soldering area changes the internal geometry.
The shielding connection is not stable.
These details may not affect basic connectivity, but they can appear clearly when testing return loss.
For SMA cable assemblies, the connector itself is only one part of the final performance. The cable selection is equally important. Different coaxial cables have different attenuation, flexibility, and frequency characteristics. Many engineers compare cable structures through the RG coaxial cable guide before selecting the final assembly solution.
What Can Cause Poor Return Loss in an RF Cable Assembly?
Is the connector always the problem?
Not necessarily.
When a return loss result is worse than expected, replacing the connector immediately is not always the correct solution.
The first step is usually checking the complete signal path.
A cable assembly contains several areas that can affect the result.
Connector machining tolerance
RF connectors are precision components.
The internal dimensions control the impedance transition.
If the following dimensions change:
- Contact pin size
- Insulator position
- Outer conductor structure
the RF performance may shift.
This is why RF connector suppliers pay close attention to machining accuracy.
Cable preparation and termination
The cable termination process is another common factor.
During assembly:
- Cable stripping length needs consistency.
- Shield connection needs good contact.
- Dielectric material should not be damaged.
- Crimping force needs control.
A cable may look normal externally while the internal transition has already changed.
This type of problem is difficult to identify without RF testing.
Additional adapters in the test path
During troubleshooting, unnecessary adapters should usually be removed.
Every adapter creates another impedance transition.
For example:
VNA → adapter → cable → adapter → DUT
will have more possible reflection points than:
VNA → cable → DUT
For high-frequency testing, simplifying the test setup often helps locate the real problem faster.
How Do Engineers Calculate Return Loss From VNA Data?
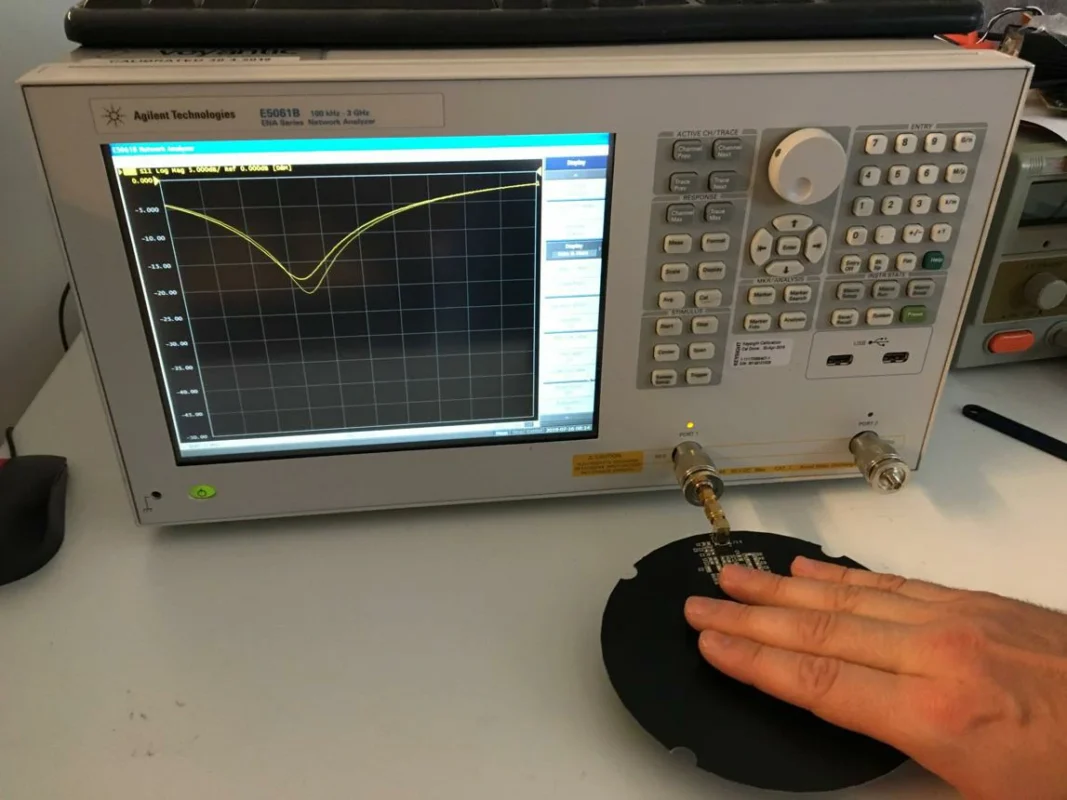
When a customer sends a VNA test screenshot, one of the first things engineers usually check is not the lowest point on the curve.
They look at the frequency range first.
A return loss value only makes sense when it is connected with the operating band.
For example, a cable assembly may show:
- Return loss: 25 dB at 1 GHz
- Return loss: 18 dB at 6 GHz
This does not automatically mean the product is unstable.
As frequency increases, small changes inside the RF path become more noticeable.
The connector interface, cable transition, and termination area all begin to influence the result.
This is why return loss evaluation is normally based on the complete frequency sweep rather than one single number.
What formula is used for return loss calculation?
The VNA measures the reflected signal and represents it through the reflection coefficient.
The symbol normally used is:
Γ (Gamma)
It represents the ratio between reflected voltage and incident voltage.
The return loss formula is:
Return Loss = -20 × log10(|Γ|)
The formula itself is simple.
The important part is understanding what the value means during a real RF test.
If the reflection coefficient becomes smaller, the return loss number becomes larger.
Example:
A connector transition with:
Γ = 0.1
means:
Return Loss = 20 dB
The reflected signal is relatively small.
For a 50 ohm RF system, this usually indicates that the impedance transition is controlled well.
How does reflected power relate to return loss?
Many customers understand RF performance better when the result is converted into power instead of voltage ratio.
The reflected power can be calculated by:
Reflected Power (%) = Γ² × 100
A few common values:
| Return Loss | Approximate Reflected Power |
| 30 dB | 0.1% |
| 20 dB | 1% |
| 15 dB | About 3% |
| 10 dB | About 10% |
For a cable assembly supplier, this difference matters.
A return loss change from 20 dB to 10 dB may only look like a 10 dB difference on the report.
But electrically, the reflected power increases significantly.
This is why RF engineers pay attention to return loss when approving:
- SMA cable assemblies
- Antenna cables
- RF test jumpers
- Microwave connections
Why do suppliers provide S11 instead of return loss sometimes?
When testing with a VNA, the original measurement parameter is usually S-parameter.
For a one-port reflection measurement:
S11 represents the reflected signal at port 1.
Many VNA instruments display S11 directly.
The screen may show:
- S11 = -15 dB
- S11 = -20 dB
- S11 = -30 dB
In engineering documents, the same performance is often written as:
- Return loss = 15 dB
- Return loss = 20 dB
- Return loss = 30 dB
The sign convention is different, but the physical meaning is related.
This difference sometimes causes unnecessary communication problems between customers and suppliers.
A customer may reject a report because the wording looks different, while both sides are actually describing the same reflection condition.
How Can Return Loss Be Converted to VSWR?
Why do RF engineers still check VSWR?
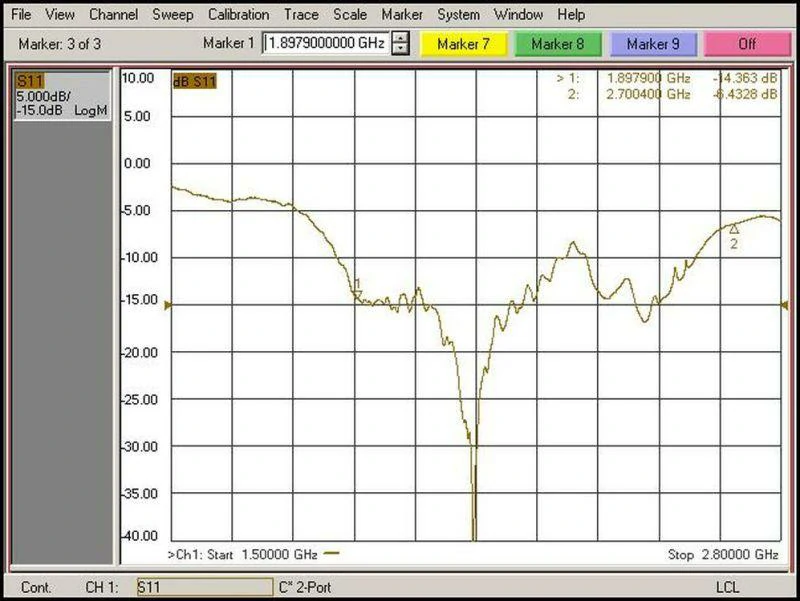
A vector network analyzer display showing an S11 return loss curve across the selected frequency range. Marker values help engineers identify resonance points, impedance mismatch, and changes in RF connector or antenna performance.
Return loss is convenient when looking at reflected energy.
VSWR is another way to describe the same mismatch.
Some industries, especially antenna-related applications, still prefer VSWR because it is commonly used in antenna specifications.
The conversion is based on reflection coefficient:
Γ = 10^(-Return Loss / 20)
Then:
VSWR = (1 + Γ) / (1 – Γ)
For example:
A return loss of 20 dB:
Γ ≈ 0.1
VSWR:
≈ 1.22:1
This means the RF system is relatively well matched.
Return Loss and VSWR Reference Table
| Return Loss | Approximate VSWR | Typical Application Understanding |
| 30 dB | 1.07:1 | Precision RF measurement |
| 20 dB | 1.22:1 | Good general RF matching |
| 15 dB | 1.43:1 | Depends on system requirement |
| 10 dB | 1.92:1 | Needs application review |
| 6 dB | 3.01:1 | Significant mismatch |
There is no universal return loss value that fits every RF product.
A laboratory calibration cable, a wireless antenna cable, and a general communication cable may have completely different acceptance standards.
How Should You Judge Return Loss Together With Insertion Loss?
Why can two RF cable assemblies have different test results?
During production evaluation, customers sometimes compare only insertion loss.
This can create confusion.
For example:
Cable A:
- Low insertion loss
- Poor return loss
Cable B:
- Slightly higher insertion loss
- Better return loss
Which one is better?
The answer depends on the application.
If the cable is used for signal transmission over distance, insertion loss may become the priority.
If the cable is connected to:
- Antenna systems
- RF measurement equipment
- Sensitive modules
impedance matching becomes more important.
Insertion Loss vs Return Loss Troubleshooting Guide
| Test Situation | Possible Reason | Next Check |
| Return loss good, insertion loss high | Cable attenuation | Check cable type and length |
| Return loss poor, insertion loss normal | Connector transition problem | Check assembly process |
| Both results poor | Multiple RF issues | Review complete design |
| Same model has different curves | Production variation | Check process control |
For RF cable assembly suppliers, the goal is not simply achieving one good number.
The goal is making every batch behave consistently.
This is why production testing usually combines:
- Return loss
- Insertion loss
- VSWR
- Continuity test
- Mechanical inspection
For customers selecting SMA assemblies, understanding the relationship between connector structure and frequency performance is also important. The SMA connector frequency range guide can help explain why higher-frequency applications require tighter control of connector dimensions and assembly quality.
How Should RF Cable Assembly Suppliers Define Return Loss Testing?
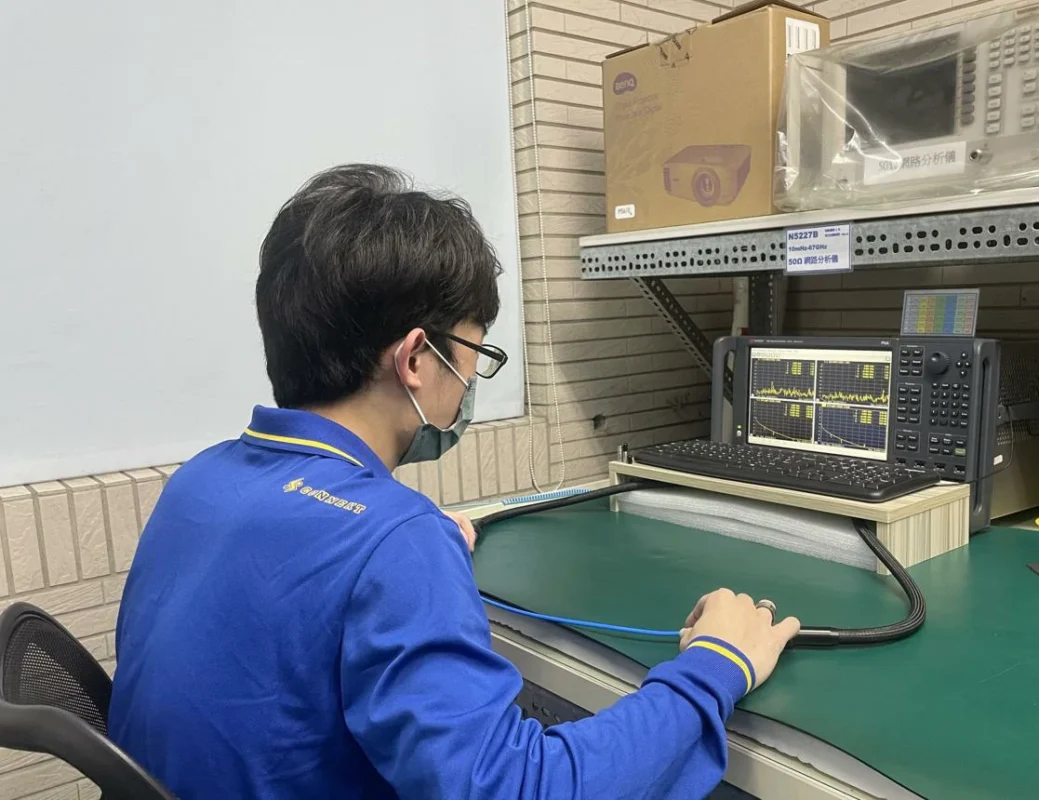
In RF cable assembly projects, return loss requirements are sometimes added at the final stage.
The customer receives smples, connects the cable to the system, and then finds that the RF performance does not match expectations.
At this point, changing the connector model or replacing the cable is not always the fastest solution.
The first thing to check is whether the original specification was clear enough.
A return loss requirement needs several conditions behind it.
For example:
A customer requests:
“Return loss should be better than 15 dB.”
The supplier still needs to know:
- At what frequency?
- Using which connector?
- With what cable?
- Measured by what method?
- Based on one sample or production batch?
Without this information, the same sentence can lead to different test results.
Why Does Frequency Range Change Return Loss Results?
A cable assembly does not have one fixed return loss value.
The result changes with frequency.
A connector transition that performs well at 900 MHz may show a different curve at 5 GHz.
This happens because RF signals are affected by physical dimensions.
At higher frequencies:
- Small gaps become electrical discontinuities.
- Connector alignment becomes more sensitive.
- Cable termination quality becomes easier to detect.
For example, an SMA cable assembly tested from DC to 6 GHz may show a smooth curve in the lower range but a higher reflection point near the upper frequency limit.
This does not always mean the whole assembly is defective.
Engineers need to locate where the change happens.
The position of the frequency peak often provides clues about the possible cause.
How Do Manufacturers Check Return Loss Problems During Production?
A return loss failure usually goes through several checks before production engineers decide the next action.
The first check is often the measurement setup.
A VNA test result depends on more than the product itself.
The condition of:
- Calibration
- Test cable
- Adapter
- Connector interface
can influence the curve.
A dirty SMA interface, for example, may create unstable measurement results.
After the test setup is confirmed, the assembly itself is reviewed.
Connector assembly inspection
RF connectors have precise internal dimensions.
During assembly, several details can affect matching:
- Center contact position
- Contact length
- Insulator condition
- Shield connection
A connector may look normal from the outside while the internal transition has changed.
This situation is common when comparing samples from different production batches.
Cable preparation inspection
The cable end preparation process also affects RF performance.
For coaxial cables, the relationship between:
- Inner conductor
- Dielectric
- Shield layer
needs to remain consistent.
If the stripping length changes or the cable structure is damaged during processing, the impedance transition may change.
This is one reason RF cable assembly production usually controls tooling and process parameters rather than relying only on final inspection.
What Return Loss Information Should Be Included in a Customer Specification?
A practical RF drawing usually contains more than one line of electrical requirements.
For example:
Cable Assembly: SMA male to SMA female
Cable Type: RG316
Impedance: 50 ohm
Frequency: DC–6 GHz
Return Loss: Customer defined limit
Test: VNA sweep measurement
This information gives both sides the same reference.
For custom RF cables, the connector and cable cannot be considered separately.
A connector designed for one cable diameter may not provide the same RF performance when installed on another cable.
The final result comes from the complete assembly.
When comparing cable options, engineers usually consider attenuation, flexibility, diameter, and frequency capability together. Information from the RG coaxial cable guide can help during the cable selection stage.
Return Loss Production Check Items
For RF cable assembly inspection, suppliers can record the following items:
| Item | Inspection Content |
| Product Model | Connector combination and cable type |
| Cable Length | Actual finished length |
| Frequency Range | VNA sweep range |
| Return Loss Requirement | Customer specification |
| Measured Curve | Actual VNA result |
| Insertion Loss | Signal attenuation result |
| Test Equipment | VNA information |
| Calibration | Calibration status |
| Sample Quantity | Inspection quantity |
| Final Result | Pass / Fail |
This record is useful when customers compare incoming inspection results with supplier data.
Many differences come from different testing conditions rather than product changes.
FAQ
How Can Buyers Avoid Return Loss Problems in Custom RF Orders?
Most problems can be reduced before production starts.
During quotation or sample confirmation, customers can provide:
- Equipment frequency range
- Connector model
- Cable model
- Required length
- Electrical requirements
- Test report requirement
A simple request such as:
“Need SMA cable with low loss”
does not provide enough information for engineering evaluation.
Different RF systems may have completely different definitions of acceptable performance.
A test cable used with a VNA and a cable used inside a communication device may use different evaluation methods.
Why Is Batch Consistency More Important Than One Excellent Sample?
RF products are often approved by sample testing first.
The sample passes.
The project moves forward.
The challenge comes during mass production.
Small process differences can affect the final result:
- Cable stripping operation
- Connector assembly force
- Tool condition
- Operator handling
Therefore, production control is important.
For repeated orders, customers usually care about whether the next batch remains close to the approved sample result.
This is especially true for RF test cables and communication equipment where unstable matching can affect the final system.
What Should Be Checked Before Accepting an RF Cable Assembly?
A complete acceptance process normally includes more than return loss.
The following items are commonly reviewed together:
| Check Item | Purpose |
| Appearance inspection | Confirm connector and cable condition |
| Continuity test | Confirm electrical connection |
| Return loss | Check impedance matching |
| Insertion loss | Check signal attenuation |
| Dimension check | Confirm mechanical requirements |
| Sample comparison | Confirm production consistency |
Return loss is one part of RF quality evaluation.
It becomes meaningful when the test condition, product structure, and application requirement are considered together.
For higher-frequency SMA applications, connector structure and frequency capability should also be evaluated together. Engineers comparing SMA solutions can refer to the SMA connector frequency range guide when selecting suitable connector designs.
What Information Should Be Provided With a Return Loss Test Report?
A VNA screenshot alone is sometimes not enough.
A useful test report normally includes:
- Product model
- Frequency sweep range
- Test setup
- Calibration information
- Connector interface
- Return loss curve
- Test date
This helps customers understand how the result was obtained.
Without test conditions, two curves from different laboratories may not be directly comparable.