
What Engineers Should Know Before Checking RF Results
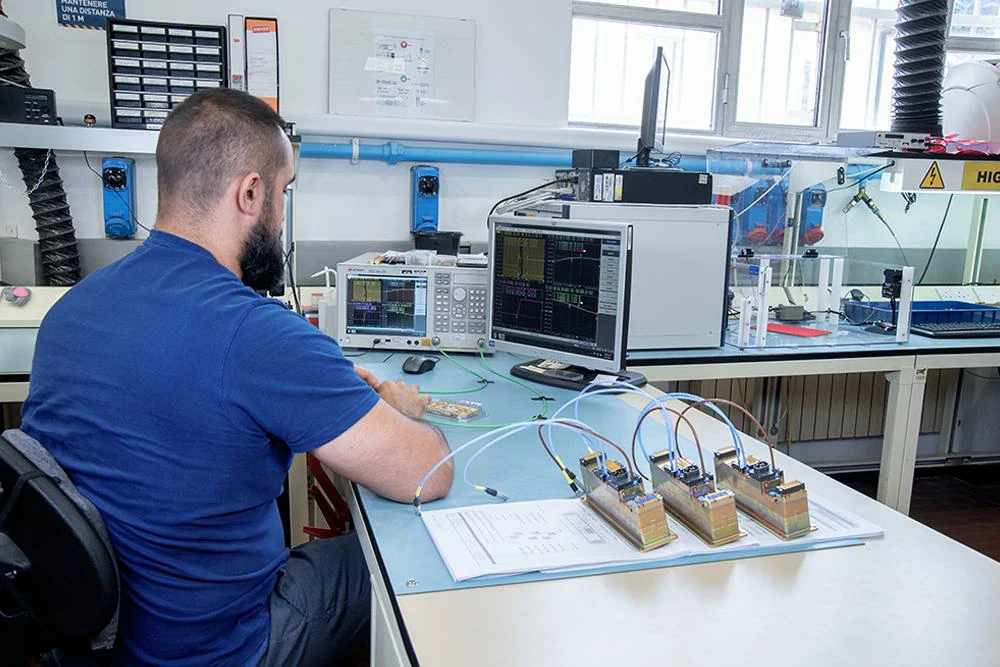
An RF engineer performs cable assembly testing in a laboratory environment. Professional RF measurement equipment is used to evaluate VSWR performance, impedance matching, and signal transmission quality for coaxial cable applications.
When an RF cable assembly fails a test, VSWR is often one of the first values engineers check.
However, the number shown on a test instrument does not directly tell where the problem is.
A VSWR result is affected by the entire RF connection path.
The connector, coaxial cable, adapter, antenna, and even the way the components are connected can change the final measurement.
For example, a customer may receive an SMA cable assembly and find that the VSWR value is different from the supplier’s report. In many cases, the cable itself is not the only factor. Different test fixtures, frequency ranges, or connection methods can also influence the result.
Before discussing cable testing, it is useful to understand how RF connectors maintain signal continuity. For SMA applications, engineers often refer to the SMA connector guide when checking connector structure, impedance, and frequency capability.
Decode VSWR Before Reading RF Test Results
VSWR is more than just a number on a test report
When RF energy moves through a cable, the ideal situation is simple:
The signal enters from one side and reaches the other side without coming back.
In reality, every RF connection has small imperfections.
A connector may have a tiny dimensional difference.
A cable termination may not be exactly identical between batches.
An antenna input may not perfectly match the cable impedance.
These small differences create reflections.
The reflected signal travels back along the transmission line and interacts with the forward signal. The result is a standing wave pattern, which is represented by VSWR.
A lower VSWR value normally indicates that less energy is being reflected.
But the number itself should not be viewed separately.
A VSWR measurement only has meaning when the following information is clear:
- Test frequency
- Cable length
- Connector type
- Measurement equipment
- Connection method
Without these details, comparing two VSWR values may lead to incorrect conclusions.
How Does Reflection Influence VSWR Results?
Forward power and reflected power in a real RF path
A simple way to understand VSWR is to look at what happens to transmitted power.
Suppose an RF source outputs 10 watts.
The signal travels through the cable toward the load.
If the load is well matched:
- Most energy continues forward
- Very little energy returns
If the load is mismatched:
- Part of the energy returns
- The RF source sees reflected power
This reflected energy is the reason VSWR increases.
In practical testing, engineers often look at VSWR together with return loss.
The two parameters describe the same physical problem from different perspectives.
VSWR uses a ratio format.
Return loss uses a dB format.
Both help identify whether the RF path has excessive reflection.
A high VSWR does not always mean the cable is defective
This point causes many misunderstandings during troubleshooting.
A cable assembly showing a higher VSWR result does not immediately prove that the cable has a quality issue.
Possible causes include:
Connector assembly
The connector may have:
- Incorrect assembly position
- Poor contact
- Mechanical damage
Testing condition
The result may change because of:
- Different VNA calibration
- Different test adapters
- Different cable positioning
System matching
The antenna or load may create the reflection.
For this reason, RF troubleshooting normally starts by checking the complete connection instead of replacing one component immediately.
Why Real RF Products Cannot Reach Perfect Matching
On paper, the best VSWR value is 1.0:1.
This represents a perfect match.
Real products are different.
Manufacturing always includes small variations.
For a coaxial cable assembly, the following details can affect the result:
- Connector machining accuracy
- Cable stripping length
- Contact position
- Shield connection
- Assembly consistency
These factors become more noticeable when the operating frequency increases.
A connection that works well at a lower frequency may require more attention when used near the upper frequency limit.
This is also why RF suppliers usually perform testing after assembly instead of judging performance only from individual component specifications.
Basic VSWR Reading Guide
| Item | What it tells you | When it is useful |
| VSWR | Reflection level of an RF path | Quick matching evaluation |
| Return Loss | Reflected signal expressed in dB | RF test reports |
| Impedance | Compatibility between components | Cable and connector selection |
| Frequency Range | Where the measurement applies | Comparing test results |
| Test Condition | How the measurement was performed | Reproducing results |
What should be remembered before checking VSWR?
A VSWR value is not an isolated specification.
It is the result of the whole RF connection.
When a measurement looks abnormal, checking the following items usually provides more information:
- Is the connector type correct?
- Is the cable suitable for the frequency?
- Was the test equipment calibrated?
- Is the antenna or load matched?
- Was the assembly installed correctly?
Understanding these details helps avoid spending time replacing parts that are not actually causing the problem.
Calculate VSWR From Test Data: Formula, Return Loss and Practical Measurement
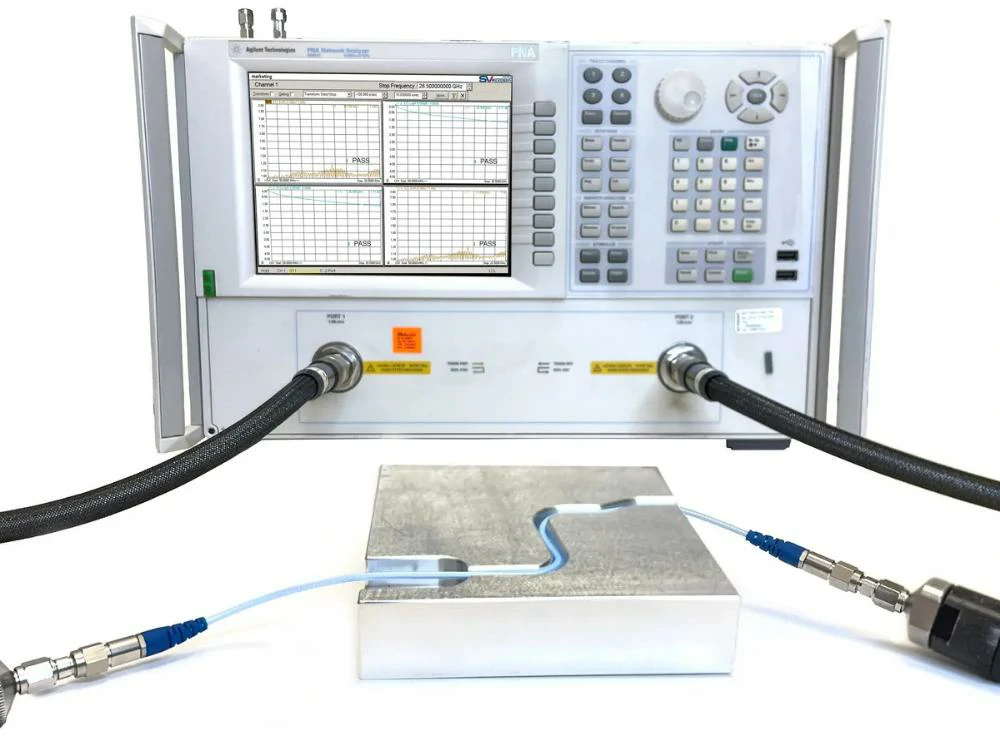
A technician measures RF connector dimensions using a digital caliper during quality inspection. Precise connector machining and assembly control help reduce impedance variation and improve VSWR consistency.
After understanding what VSWR represents, the next question usually appears during testing:
How is this value calculated?
Many RF engineers see VSWR numbers on a VNA report but do not always need to calculate them manually. Modern instruments already provide the result.
However, understanding the calculation method is still useful.
It helps when:
- Checking whether a test report is reasonable
- Comparing return loss and VSWR results
- Explaining RF performance to customers
- Reviewing supplier test data
In actual RF projects, the calculation is not the difficult part. The difficult part is understanding what the number represents and whether it matches the real application.
How Do You Calculate VSWR From Forward and Reflected Power?
Understanding the relationship between power and reflection
VSWR comes from the relationship between:
- Forward signal
- Reflected signal
When a transmission line is perfectly matched, almost all energy moves toward the load.
When mismatch occurs, some energy returns.
The amount of returned energy determines the reflection coefficient.
The formula is:
|Γ| = √(Reflected Power / Forward Power)
Where:
- Γ represents the reflection coefficient
- Reflected Power is the returned RF energy
- Forward Power is the transmitted RF energy
After obtaining the reflection coefficient:
VSWR = (1 + |Γ|) / (1 – |Γ|)
For example:
A system sends:
20 W forward power
Measured reflected power:
0.2 W
The reflection coefficient is:
√(0.2 / 20)
= 0.1
Then:
VSWR = (1+0.1)/(1-0.1)
≈ 1.22:1
This means the RF path has a relatively small reflection level.
Why engineers do not judge VSWR by the number alone
A VSWR value only makes sense when the test condition is known.
For example:
A cable assembly measured at:
- 900 MHz
may show a different result at:
- 5.8 GHz
The same cable can have different performance because electrical behavior changes with frequency.
The result can also change because of:
- Different VNA calibration
- Different adapters
- Different cable positioning
- Different connector torque
This is why professional RF test reports normally include frequency range and measurement conditions instead of showing only one VSWR number.
VSWR Calculation Reference Table
| Test Item | Formula / Meaning | Example |
| Forward Power | Input RF energy | 10 W |
| Reflected Power | Returned energy | 0.1 W |
| Reflection Coefficient | √(Pr/Pf) | 0.1 |
| VSWR Formula | (1+Γ)/(1-Γ) | 1.22:1 |
| Reflection Percentage | Pr/Pf ×100% | 1% |
How Do You Convert Return Loss to VSWR?
Why return loss is often used in RF reports
When looking at VNA measurement data, engineers often see another parameter:
Return Loss
Unlike VSWR, return loss is expressed in dB.
The relationship is simple:
- Higher return loss value = better matching
- Lower reflected energy = better RF performance
For example:
A return loss of:
30 dB
indicates a much smaller reflection compared with:
10 dB
Use the return loss conversion formula
The conversion process starts with the reflection coefficient:
|Γ| = 10^(-Return Loss / 20)
Then:
VSWR = (1+|Γ|)/(1-|Γ|)
Example:
Return loss:
20 dB
Reflection coefficient:
10^(-20/20)
=0.1
VSWR:
(1+0.1)/(1-0.1)
=1.22:1
This is why engineers can describe the same RF condition using different formats.
One report may show:
- VSWR: 1.22:1
Another report may show:
- Return Loss: 20 dB
Both describe the same matching condition.
Return Loss and VSWR Quick Conversion
| Return Loss | Approximate VSWR | Practical Understanding |
| 30 dB | 1.07:1 | Excellent matching |
| 26 dB | 1.10:1 | Very good RF connection |
| 20 dB | 1.22:1 | Suitable for many RF applications |
| 15 dB | 1.43:1 | Check system requirement |
| 10 dB | 1.92:1 | Reflection becomes noticeable |
| 6 dB | 3.01:1 | Poor matching condition |
How Should Engineers Read a VSWR Chart?
Start with the frequency range before checking the curve
A VSWR graph without frequency information can easily be misunderstood.
For example:
A cable assembly may show:
VSWR <1.3
from:
0.5–3 GHz
But the same assembly may not maintain that value from:
3–6 GHz
Before judging the result, check:
- Frequency sweep range
- Measurement setup
- Connector type
- Cable length
The operating band matters more than a single point measurement.
The shape of the curve often tells more than the lowest value
A common mistake is focusing only on the lowest VSWR point.
For example:
Curve A:
- Smooth response across the entire band
Curve B:
- Very low value at one frequency
- Large changes elsewhere
For many applications, Curve A may actually be the better choice.
What abnormal VSWR curves may indicate
During troubleshooting, different curve patterns can suggest different issues.
Sudden narrow spike
Possible causes:
- Connector damage
- Poor contact
- Mechanical movement
Overall increase across the band
Possible causes:
- Wrong cable impedance
- Incorrect component combination
- Assembly problem
Performance changes after movement
Possible causes:
- Cable damage
- Loose connector
- Poor mechanical stability
A VSWR chart is not only a pass/fail document.
It is also a troubleshooting tool.
How Are VSWR and Return Loss Different During RF Testing?
Use VSWR for quick matching evaluation
VSWR is easier to understand because the ideal target is simple:
Closer to:
1.0:1
means better matching.
This makes it commonly used for:
- Production inspection
- Customer acceptance
- Field testing
Use return loss for engineering analysis
Return loss is more common in detailed RF reports.
It works well with:
- VNA measurement
- RF design verification
- Antenna matching analysis
For engineers reviewing RF cable assemblies, both values are useful.
Neither replaces the other.
They simply present the same reflection problem from different angles.
Return Loss vs VSWR Comparison
| Parameter | VSWR | Return Loss |
| Unit | Ratio | dB |
| Better Direction | Closer to 1 | Higher value |
| Common Use | Quick evaluation | Engineering report |
| Measurement Source | VNA / RF tester | VNA / RF tester |
| Main Purpose | Matching judgment | Reflection analysis |
A Practical Example: Why Two VSWR Reports May Look Different
A customer may receive the same model RF cable assembly from two suppliers.
Supplier A reports:
VSWR ≤1.20
Supplier B reports:
VSWR ≤1.35
Does it automatically mean Supplier A has better quality?
Not necessarily.
Before comparing results, the testing conditions must be the same.
This is especially important for RF cable assemblies used in higher frequency applications.
For example, when selecting SMA assemblies, engineers usually check not only connector type but also cable structure, frequency range, and testing method. A suitable SMA cable assembly should match the actual working environment instead of only meeting a single specification number.
VSWR Testing in RF Cable Assemblies: Why the Same Cable Can Show Different Results
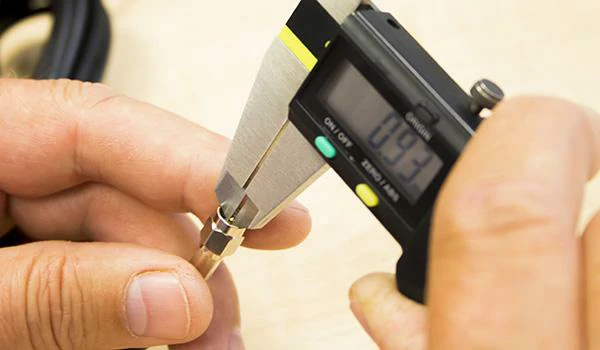
A vector network analyzer displays measurement results from an RF cable assembly test. Engineers analyze VSWR curves and frequency response data to confirm RF transmission performance before shipment.
During RF cable testing, one situation appears quite often.
A customer receives the same cable assembly model that was tested before, but the measured VSWR value is slightly different.
At first glance, this can look like a quality issue.
However, RF testing is not as simple as checking a resistance value with a multimeter. The final result depends on the complete measurement environment.
The cable is only one part of the system.
The connector, adapter, test fixture, calibration status, and even the way the cable is positioned during measurement can influence the result.
This is why experienced RF engineers usually check the entire test condition before making a conclusion.
The connector is usually the first place to check
In an RF cable assembly, the connector transition area is very important.
A coaxial cable maintains impedance through its structure. Once the cable connects to a connector, the internal geometry changes.
The transition between:
- Center conductor
- Dielectric material
- Shield layer
needs to remain controlled.
A small difference may not affect low-frequency signals, but at higher frequencies the same difference can become visible in the measurement.
For example, two SMA connectors may have the same external appearance, but differences in machining tolerance or assembly process can influence the final RF performance.
This is also why connector selection should not only focus on the interface type. The frequency range, impedance requirement, and cable compatibility all need to be considered together.
Engineers working with SMA systems often review SMA connector guide information before selecting components for a new RF design.
Cable type changes more than attenuation
When discussing coaxial cables, many people focus mainly on insertion loss.
However, cable structure also affects impedance stability.
Different coaxial cables use different:
- Dielectric materials
- Conductor sizes
- Shielding structures
- Mechanical designs
A flexible cable may be suitable for applications where installation space is limited.
A semi-rigid cable may provide better mechanical stability when the RF path needs tighter control.
Why adding adapters can change the measurement
Adapters solve a practical problem.
Different devices often use different connector interfaces.
A conversion may be necessary.
For example:
A test instrument uses an SMA port, while the equipment under test uses an N connector.
An adapter provides the connection.
However, every additional interface creates another electrical transition.
A single adapter may not create a noticeable problem.
Several adapters connected together may produce a different result.
This becomes more obvious at higher frequencies.
When testing near the upper frequency limit of a system, reducing unnecessary connections usually helps improve measurement consistency.
For applications requiring connector conversion and cable integration, engineers often consider RF adapter cables instead of combining multiple separate adapters.
What Should Be Included in an RF Cable Test Report?
A good RF test report should allow another engineer to understand how the result was obtained.
A VSWR value without test information has limited meaning.
For example:
VSWR: 1.25
This number alone does not explain:
- At what frequency?
- Using what equipment?
- With what connector?
- Under what calibration condition?
A more useful report normally includes:
| Test Information | Example |
| Product | SMA cable assembly |
| Cable type | RG316 / RG58 / RG142 |
| Frequency range | DC-6GHz |
| VSWR requirement | ≤1.30 |
| Return loss | dB value |
| Test equipment | VNA model |
| Test date | Production record |
This information helps suppliers and customers compare results correctly.
FAQ
1. What is VSWR measurement in RF cable testing?
VSWR measurement is a method used to evaluate how much RF signal is reflected back from a transmission path. It shows the matching condition between components such as RF cables, connectors, antennas, and loads. A lower VSWR value generally indicates less reflection and better impedance matching.
In RF cable assembly testing, VSWR should be evaluated together with test frequency, cable type, connector design, and measurement setup to obtain meaningful results.
2. How is VSWR calculated from forward and reflected power?
VSWR is calculated by first determining the reflection coefficient (Γ) from forward power and reflected power.
The formula is:
|Γ| = √(Reflected Power / Forward Power)
Then:
VSWR = (1 + |Γ|) / (1 – |Γ|)
For example, when forward power is 20W and reflected power is 0.2W, the reflection coefficient is 0.1, resulting in a VSWR value of approximately 1.22:1.
3. Does a high VSWR mean the RF cable assembly is defective?
Not always. A high VSWR result does not immediately indicate a cable quality problem.
The measurement can be affected by multiple factors, including:
- Connector assembly accuracy
- Poor contact or mechanical damage
- VNA calibration condition
- Test adapters
- Cable positioning
- Antenna or load matching
Engineers should check the complete RF connection path before replacing the cable assembly.
4. What is the relationship between VSWR and return loss?
VSWR and return loss describe the same RF reflection issue from different perspectives.
VSWR uses a ratio format, while return loss uses a dB value.
The relationship is:
- Lower VSWR means better matching
- Higher return loss means better matching
For example, a VSWR of approximately 1.22:1 corresponds to a return loss of about 20 dB.
5. Why can the same RF cable show different VSWR test results?
The same RF cable assembly may show different VSWR values because the measurement result depends on the entire testing environment.
Common reasons include:
- Different VNA calibration
- Different test fixtures
- Different adapters
- Different frequency ranges
- Different connector torque
- Different cable installation position
For accurate comparison, suppliers and customers should use the same test conditions and measurement methods.