
Read S Parameters Before Opening a VNA Report
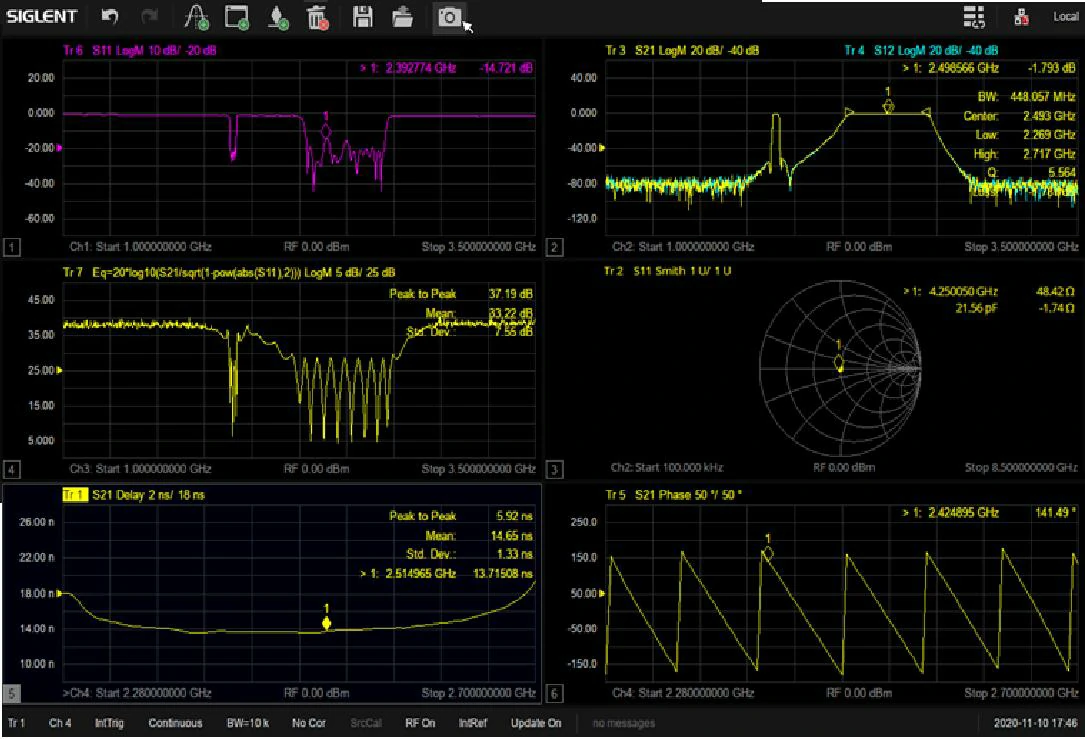
Vector network analyzer displaying S parameter test results for RF connectors and coaxial cable assemblies, including reflection, transmission, phase, group delay, and Smith chart measurements.
When engineers receive an RF test report, the first reaction is often to search for a single number: insertion loss, VSWR, or frequency range.
However, modern RF assemblies are rarely judged by one parameter alone.
A connector, adapter, or coaxial cable assembly creates a complete signal path. Every transition between components can influence how much energy is reflected, how much signal is transferred, and how stable the connection remains across frequency.
Before analyzing S11 or S21 curves, it helps to understand the complete RF path. A connector does not work independently—the cable type, impedance matching, and termination method all affect the final measurement result. Engineers often review a broader SMA connector guide before selecting an SMA-based RF assembly because connector structure and frequency capability directly influence measurement stability.
Unlike simple continuity testing, S parameter measurements show what happens at high frequencies where small mechanical differences become electrical problems.
Explain S Parameters in RF Connector Language
Understand scattering parameters through real RF components
The term “S parameter” can sound theoretical because it originates from microwave network analysis.
In practical RF hardware, the concept is much easier to understand.
Imagine an RF signal traveling through this path:
Signal source → SMA connector → coaxial cable → adapter → antenna or load
When the signal reaches each transition point, several things can happen:
S parameters describe these behaviors mathematically.
For passive RF components, the most common measurements are:
- S11 — input reflection
- S21 — forward transmission
- S12 — reverse transmission
- S22 — output reflection
For a simple two-port cable assembly, engineers usually focus first on S11 and S21 because they directly answer two practical questions:
- Is the connection properly matched?
- How much signal passes through the assembly?
This is especially important for assemblies using 50-ohm RF components. A mismatch between connector impedance, cable impedance, or adapter design can increase reflected energy and reduce system margin.
For example, a typical SMA cable assembly using RG316 or RG58 cable needs consistent impedance from connector to connector. The cable itself becomes part of the RF network rather than just a mechanical connection. TEJTE’s RF coaxial cable guide explains how cable construction, impedance, and attenuation influence the final RF path.
S11
S11 represents the signal reflected back from Port 1.
A high reflection means the RF energy is not being efficiently transferred into the device.
Common causes include:
- incorrect connector type
- poor impedance matching
- damaged connector contact
- cable deformation
- improper termination
S21
S21 represents the signal transferred from Port 1 to Port 2.
For passive RF assemblies, S21 is normally shown as a negative dB value because every cable and connector introduces some loss.
A larger negative value means more signal attenuation.
Typical causes of poor S21 performance include:
- excessive cable length
- high-loss coaxial cable selection
- connector insertion loss
- poor manufacturing consistency
Keep S Parameter Discussion Focused on Passive RF Paths
Why passive RF assemblies need S parameter evaluation
This article focuses on passive RF paths because these components are often underestimated during system design.
RF connectors, coaxial cables, adapters, and cable assemblies may look simple from a mechanical perspective, but electrically they form part of the transmission line.
A small change in geometry can affect impedance.
Examples include:
- center pin misalignment
- incorrect dielectric dimensions
- incomplete shielding contact
- connector damage after repeated mating
- excessive bending near the connector
At low frequencies, these issues may not be obvious.
At GHz frequencies, they appear as:
- higher reflection
- unstable VSWR
- increased insertion loss
- ripple in VNA traces
For example, an SMA cable assembly designed for Wi-Fi, LTE, GNSS, or laboratory testing may need different S parameter expectations depending on:
- operating frequency
- cable length
- connector type
- acceptable system loss
- application environment
A short RG316 jumper inside an enclosure and a 3-meter RF test cable should not necessarily have the same acceptance criteria.
The cable selection itself affects S parameter behavior. Engineers often compare cable families before finalizing an assembly because flexibility, attenuation, and frequency capability are closely connected. TEJTE’s SMA cable selection guide provides additional context on how RG316, RG174, RG58, and other coaxial cables affect SMA assembly performance.
Which S Parameter Matters First for RF Connectors?
Use S11 to check input-side matching
When engineers first review a VNA report, S11 is usually the first reflection parameter to check.
The reason is simple:
Before asking whether the signal can pass through the assembly, confirm that the signal can enter the assembly correctly.
S11 shows how much energy returns from the input port.
A good RF connector assembly normally maintains low reflection across the intended frequency range.
Poor S11 performance can indicate:
- wrong connector impedance
- damaged mating surface
- poor soldering or crimping
- incorrect cable preparation
- mechanical stress after assembly
For example, an SMA connector rated for 0–6 GHz may show acceptable performance at lower frequencies but reveal instability near the upper band if manufacturing consistency is poor.
This is why RF engineers normally check the complete S11 curve rather than only one frequency marker.
How Do S11 and S21 Split Reflection From Transmission?
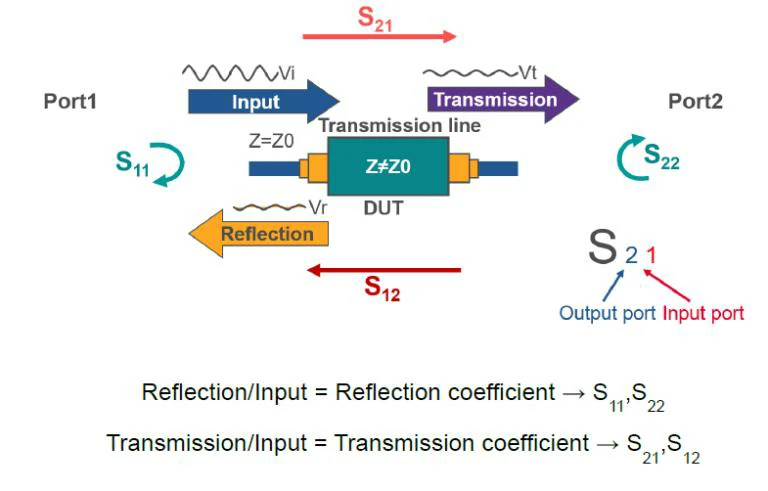
Diagram showing how S11 and S22 represent signal reflection at the input and output ports, while S21 and S12 represent forward and reverse signal transmission in a two-port RF network.
When engineers look at an S-parameter report, two curves usually attract the most attention:
S11 and S21.
Although both values come from the same VNA measurement, they describe completely different parts of RF behavior.
S11 focuses on what happens when the signal reaches the input port.
S21 focuses on what happens after the signal travels through the device.
For passive RF assemblies such as SMA cables, coaxial adapters, and connector transitions, understanding the difference between these two parameters prevents many incorrect conclusions during testing.
Compare S11 With Return Loss Before Judging Connector Quality
Understand what S11 says about impedance matching
S11 is a reflection coefficient.
It describes the relationship between the reflected signal and the incident signal at Port 1.
In simple RF engineering terms:
S11 answers: “How much signal comes back because the RF path is not perfectly matched?”
A lower reflection value usually means better matching.
For example:
- A connector with stable 50-ohm impedance normally shows better S11 performance.
- A damaged connector interface may create unexpected reflection.
- An incorrectly assembled cable may show spikes or unstable movement in the S11 curve.
However, engineers often see return loss instead of S11 because many RF specifications use return loss as the reporting format.
The relationship is:
Return Loss (dB) = -20 × log₁₀(|S11|)
A stronger return loss value means less reflected energy.
For example:
| S11 Magnitude | Approximate Return Loss | Interpretation |
| 0.1 | 20 dB | Good matching |
| 0.05 | 26 dB | Better matching |
| 0.01 | 40 dB | Excellent matching |
The actual requirement depends on frequency, connector type, and application.
A laboratory test cable operating near microwave frequencies may require tighter control than a short internal antenna cable.
Engineers often compare S11 results with VSWR because both describe impedance matching behavior. TEJTE’s VSWR testing guide provides additional background on how reflected energy affects RF system performance.
Compare S21 With Insertion Loss When Checking Signal Transfer
Understand how much RF energy reaches the output port
S21 describes forward transmission.
It measures how much signal travels from Port 1 to Port 2.
However, an abnormal S21 curve may indicate:
- excessive cable loss
- poor connector contact
- wrong cable specification
- internal damage
- adapter transition loss
For buyers selecting RF cable assemblies, S21 is often one of the most practical parameters because it directly affects available signal power.
A GPS antenna cable, Wi-Fi module cable, or RF test cable may all use similar connectors but require different insertion loss targets.
For example:
A 10 cm SMA cable and a 2 meter SMA cable cannot be judged using the same S21 expectation.
Cable length, conductor material, dielectric structure, and operating frequency all influence transmission loss.
TEJTE’s RF cable assembly guide explains how cable construction choices influence RF performance in real applications.
S11 vs S21 Decision Table
| Parameter | Signal Direction | Main Question Answered | Related Metric | Better Direction | Typical RF Issue | Buyer Action |
| S11 | Reflected signal from input port | Is the RF path properly matched? | Return Loss / VSWR | Lower reflection | Impedance mismatch, connector problem | Check connector design and assembly quality |
| S21 | Forward signal from input to output | How much signal passes through? | Insertion Loss | Closer to 0 dB | Cable loss, adapter loss, material loss | Confirm cable type, length, and frequency range |
| S12 | Reverse transmission | Does reverse signal behave correctly? | Reverse Isolation | Lower reverse transfer | Unexpected coupling | Check system requirements |
| S22 | Output reflection | Is the output port matched? | Return Loss | Lower reflection | Load mismatch | Verify output connection condition |
This table helps separate two common mistakes:
A cable assembly may have acceptable S11 but poor S21.
This means the connector matching is acceptable, but the transmission loss may be too high.
The opposite can also happen.
A cable may show acceptable S21 at one frequency but poor S11 because the connector transition creates reflections.
Use S Parameters to Judge SMA Cable Assemblies
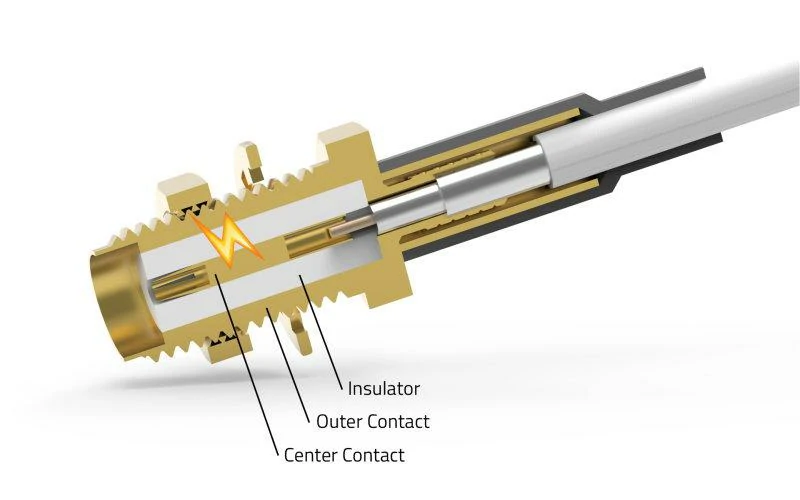
Internal structure of an SMA RF connector showing the center contact, insulator, outer contact, and coaxial cable termination. Connector geometry affects impedance matching, return loss, and S11 performance.
Apply S11 and S21 to a 0–6GHz cable path
A common RF engineering example is an SMA cable assembly used between a radio module and antenna.
The complete path may include:
SMA connector → coaxial cable → SMA connector → antenna port
Even though the cable appears simple, the RF signal experiences multiple transitions.
Each section can influence the final measurement:
SMA connector interface
The connector determines:
- mechanical alignment
- impedance transition
- contact quality
Coaxial cable section
The cable determines:
- attenuation
- shielding effectiveness
- phase stability
Final termination
The connected device affects:
- reflection
- matching condition
- measured S11
For a 0–6GHz SMA cable assembly, engineers usually review:
- S11 across the full frequency range
- S21 insertion loss curve
- unexpected ripple
- sharp resonance points
A single marker value at 2 GHz may not represent actual performance.
A cable can look acceptable at one frequency but become unstable near the upper operating limit.
Avoid judging an RF assembly only by connector frequency rating
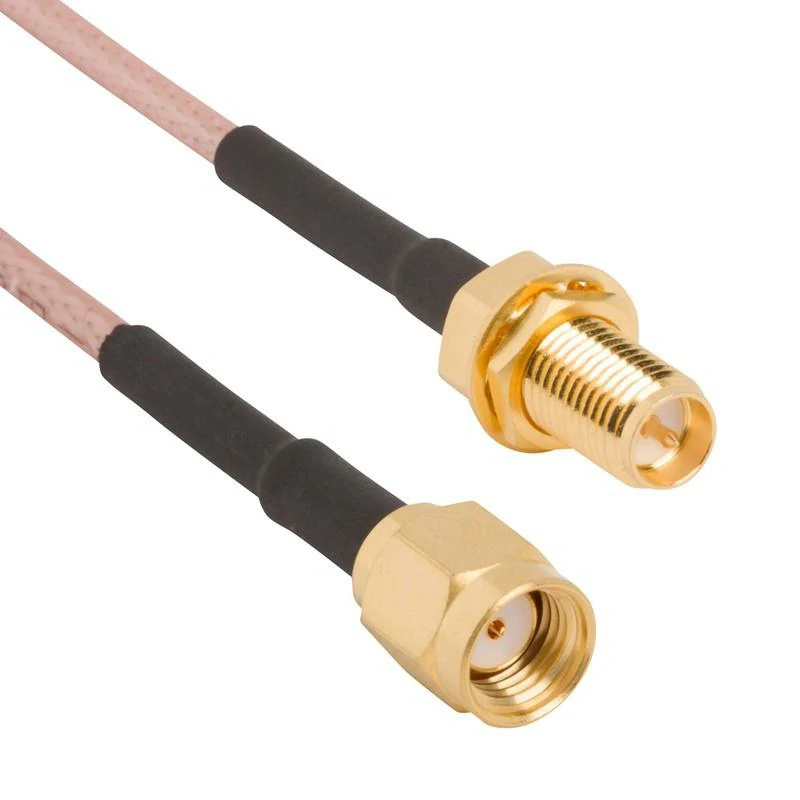
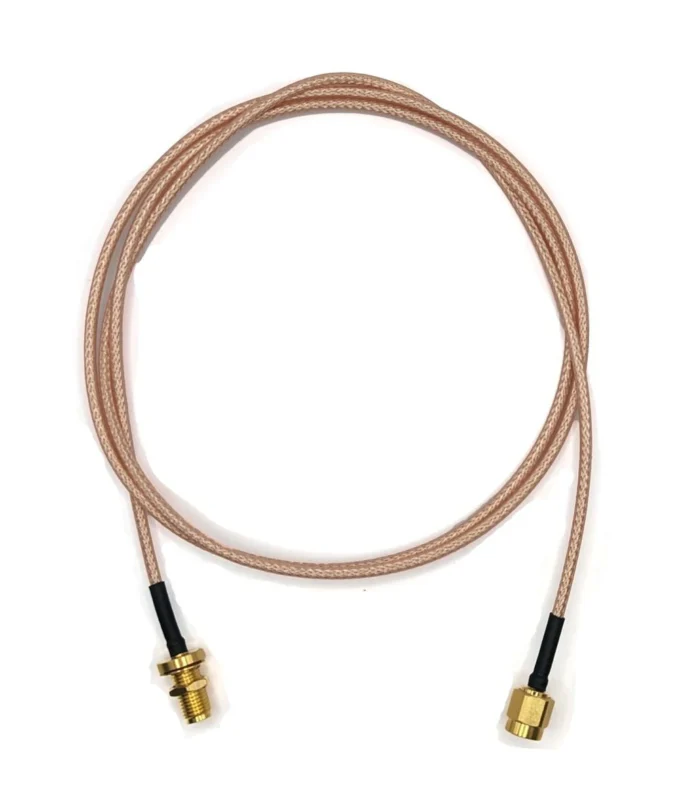
Flexible RF coaxial cable assembly with an SMA male connector and an SMA female bulkhead connector. The assembly can be evaluated using S11 and S21 measurements for impedance matching and insertion loss.
A connector specification may state:
“DC–6GHz”
However, the final cable assembly performance depends on more than the connector itself.
The actual RF path includes:
- connector geometry
- cable type
- assembly process
- cable length
- mating condition
For example:
An SMA connector combined with RG316 cable may behave differently from the same connector combined with RG58 cable.
The connector frequency rating does not automatically guarantee identical S11 and S21 performance.
This is why RF engineers normally evaluate the complete assembly rather than individual parts.
Request full S-parameter data when the application requires repeatability
Not every RF cable needs a complete Touchstone file.
For simple low-frequency connections, basic specifications may be enough.
However, S parameter data becomes valuable when dealing with:
- antenna development
- RF test fixtures
- production calibration cables
- 6GHz communication systems
- repeat engineering builds
A useful supplier test report should include:
- tested frequency range
- S11 curve
- S21 curve
- VNA model
- calibration method
- connector configuration
- cable length
Without test conditions, two suppliers may provide different curves that cannot be directly compared.
How Can Engineers Read S-Parameter Results Without Misjudging an RF Assembly?
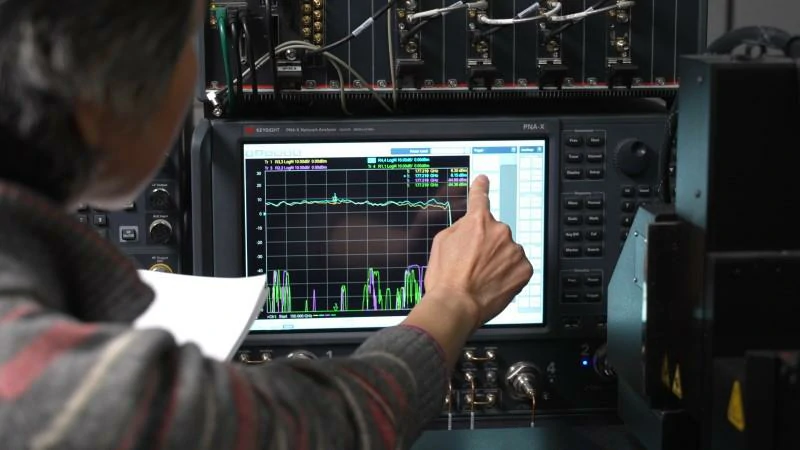
RF engineer using a vector network analyzer to measure S11, S21, return loss, insertion loss, and frequency response of RF connectors, adapters, and coaxial cable assemblies.
A VNA screenshot can look convincing at first glance.
A smooth curve, a low loss value, and a few markers inside the expected range often make an RF assembly appear acceptable.
However, engineers who work with RF production know that a single trace rarely tells the complete story.
The same cable assembly can show different results depending on:
- where the calibration plane is located
- which adapters are installed
- how the connector is tightened
- whether the cable was bent during measurement
- how close the test frequency is to the operating limit
This is why experienced engineers usually spend time checking the measurement condition before deciding whether a component is good or bad.
Check the Test Setup Before Blaming the Cable Assembly
Confirm the measurement environment first
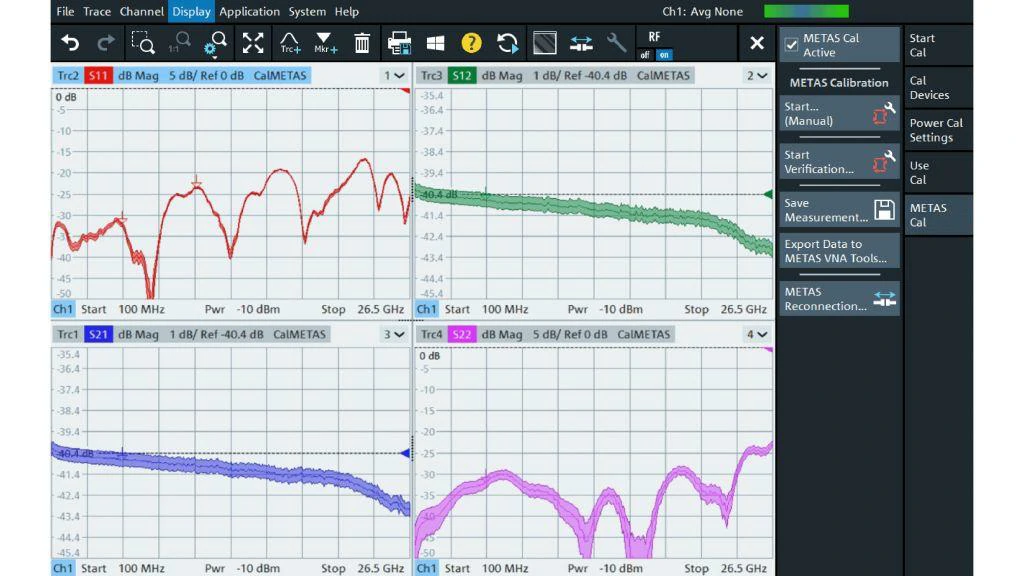
Vector network analyzer screen displaying S11, S12, S21, and S22 traces across a frequency range up to 26.5 GHz. These measurements help evaluate port matching, signal reflection, forward transmission, and reverse transmission.
When a VNA result looks unusual, the product is not always the first thing to investigate.
A measurement system includes more than the device under test.
The complete path may contain:
- VNA ports
- calibration cables
- adapters
- fixtures
- the tested RF assembly
For example, a worn SMA adapter can introduce additional reflection.
The VNA will measure that reflection together with the cable under test.
This can create a false impression that the cable has poor S11 performance.
This method helps separate a product problem from a test setup problem.
Engineers working with high-frequency RF paths usually pay close attention to impedance continuity because even a small transition problem can become visible at GHz frequencies. TEJTE’s 50 ohm coaxial cable guide explains why maintaining consistent impedance is important for stable RF transmission.
How Should Engineers Build an S-Parameter Acceptance Standard?
Avoid copying specifications from another RF project
One of the common mistakes in RF purchasing is using an existing S-parameter requirement without checking whether the application is similar.
A requirement designed for a laboratory test cable may be unnecessary for a short internal connection.
The opposite is also true.
A general-purpose antenna cable may not provide enough margin for a precision RF measurement system.
Before setting limits, engineers normally consider:
- operating frequency
- cable length
- connector interface
- expected signal level
- system loss budget
A realistic specification is easier for both the customer and supplier to verify.
S-Parameter Acceptance Matrix
| Application | Frequency Range | Typical Cable | Connector Example | Main S11 Concern | Main S21 Concern | Testing Priority |
| Internal device connection | Below 3GHz | RG174 / thin coax | SMA / IPEX | Stable matching | Basic attenuation | Medium |
| Wireless antenna cable | 2.4–6GHz | RG316 / low-loss coax | SMA / MMCX | Reflection near band edge | Cable attenuation | High |
| RF measurement cable | DC–6GHz or higher | RG142 / RG405 | SMA / N | Repeatability | Low insertion loss | Very High |
| Communication module cable | Sub-6GHz | Flexible coax | Custom connector | Interface stability | System loss budget | High |
The purpose of this table is not to define universal pass values.
Instead, it helps engineers decide what should be measured first.
A GPS antenna lead, for example, may focus more on insertion loss.
A calibration cable may require tighter reflection control because measurement accuracy depends on repeatability.
Review the Curve Shape Instead of Only Looking at Pass Numbers
Understand what the trace is telling you
A report showing:
- S11: -20 dB
- S21: -1.5 dB
does not automatically mean the assembly is perfect.
The frequency response behind those numbers matters.
A typical good trace usually has:
- gradual change with frequency
- no sudden resonance points
- stable behavior between samples
Unexpected patterns often provide clues.
S11 suddenly rises at one frequency
Possible reasons:
- connector transition issue
- damaged contact
- dielectric deformation
S21 drops faster than expected
Possible reasons:
- cable attenuation higher than specification
- longer actual cable length
- poor internal connection
Multiple samples show different curves
Possible reasons:
- assembly consistency problem
- connector mating variation
- process control issue
This type of comparison is often more useful than checking only one acceptance number.
Why Do 6 GHz Applications Require More S-Parameter Attention?
Evaluate performance close to the operating limit
RF components often look stable at lower frequencies.
The challenge appears near the upper operating range.
For a component specified as DC–6GHz, performance around 5–6GHz is usually more valuable than a measurement at hundreds of MHz.
At higher frequencies:
- connector dimensions become more critical
- small impedance changes create larger effects
- cable loss increases
- adapter influence becomes easier to observe
This is particularly relevant for:
- Wi-Fi 6E devices
- Wi-Fi 7 hardware
- sub-6GHz wireless systems
- RF validation equipment
Engineers selecting SMA assemblies often compare connector frequency capability with cable characteristics rather than evaluating the connector alone. TEJTE’s SMA connector frequency range guide provides additional information about SMA operating limits and design considerations.
Check connector assembly quality during investigation
High-frequency performance depends heavily on manufacturing consistency.
Areas worth checking include:
- center conductor position
- solder temperature
- crimp pressure
- shielding contact
- dielectric damage
A connector may look mechanically acceptable but still create electrical discontinuity.
This is why VNA testing is often used for RF-critical cable assemblies.
How Should Buyers Define S-Parameter Requirements?
Write measurable requirements instead of general quality descriptions
A useful RF specification normally includes:
- impedance
- connector model
- cable type
- length
- frequency range
- S11 requirement
- S21 requirement
- testing method
Example:
“SMA male to SMA female cable assembly, 50 ohm, RG316, 500mm length, tested from DC to 6GHz with VNA measurement. Provide S11 and S21 curves.”
This type of requirement allows both sides to evaluate the same standard.
Request measurement files when repeatability matters
For simple prototype cables, a PDF report may be sufficient.
For production programs, engineers may request:
- VNA screenshots
- PDF reports
- Touchstone files
These records help compare:
- different production batches
- engineering samples
- supplier changes
Outgoing S-Parameter Inspection Sheet
| Inspection Item | Recorded Information |
| Product Model | RF cable assembly model |
| Connector Combination | SMA / N / TNC etc. |
| Cable Type | RG316 / RG142 / RG58 |
| Cable Length | Actual length |
| Test Frequency | Sweep range |
| Equipment | VNA model |
| Calibration Method | SOLT / other method |
| S11 Result | Curve and value |
| S21 Result | Curve and value |
| Adapter Used | Test configuration |
| Final Result | Pass / Fail |
| Inspector | Date and operator |
Final Considerations Before Approving an RF Assembly
S parameters are not only numbers shown in a VNA report.
They represent how the complete RF path behaves under operating conditions.
For connectors and cable assemblies:
- S11 helps identify matching problems.
- S21 helps evaluate transmission loss.
- The complete curve shows behavior across frequency.
- Test conditions determine whether the result is meaningful.
A reliable RF evaluation process combines measurement data with practical engineering judgment.
The goal is not simply to achieve the lowest possible number.
The goal is to select an RF path that remains stable in the actual system.
FAQ
Can a cable have good S11 but poor S21?
Yes. A cable may have acceptable impedance matching but still introduce excessive transmission loss because of cable material, length, or internal damage.
Why does the same SMA cable show different VNA results?
Possible reasons include calibration condition, adapter differences, connector torque, and measurement setup.